July 2015
Melissa Favreault
Urban Institute
Judith Dey
Office of the Assistant Secretary for Planning and Evaluation
Long-term care services and supports (LTSS) includes a range of services and supports individuals may need to meet their health or personal needs over a long period of time. Most LTSS is not medical care, but rather assistance with the basic personal tasks of everyday life, sometimes called "Activities of Daily Living" (or ADLs) which include such everyday tasks as bathing, dressing, toileting and eating (Doty & Shipley, 2012). Many Americans prefer not to think about this need for assistance or who will provide it. They underestimate how likely it is they will need it and how much it will cost (Wiener et al., 2015; Kane, 2013; Tompson et al., 2013). Even if they correctly consider the chances of becoming disabled and needing daily help, many Americans mistakenly assume their health insurance covers these costs. However, health insurance does not cover LTSS costs, and Medicare, the major public insurance program for older Americans, does not cover most LTSS expenses (Centers for Medicare & Medicaid Services, 2015).
While Medicaid provides LTSS to those with chronic disabling conditions (Komisar,2013; Tompson et al., 2013), it is only available for individuals who meet income and other eligibility requirements (U.S. Department of Health & Human Services, 2015). A private market for LTSS insurance exists, but less than 8 percent of Americans have purchased it (Freundlich, 2014), in part due to high and rising premiums, and exit of insurers from the market (Scism, 2015). Sales figures from recent years suggest there has been stagnation, or even decline, in the market (Cohen, 2014). For some, the costs of LTSS are likely to outstrip retirement savings. Researchers at the Employee Benefit Research Institute found that projected LTSS expenses greatly contributed to projections of retirement deficits (VanDerhei, 2015).
As the United States population ages, a higher proportion of individuals will likely need and use LTSS. Most Americans who receive formal LTSS pay out-of-pocket. For those with longer spells, they may pay out-of-pocket until they qualify for Medicaid. Reliance on Medicaid for those that cannot afford the full costs of LTSS may result in increased federal and state spending for LTSS. According to projections produced by the Congressional Budget Office, due to population growth, LTSS expenses (including all formal care, Medicaid and other private and public sources of payment) could more than double from 1.3 percent of gross domestic product (GDP) in 2010 to 3 percent of GDP in 2050 if the rate of functional limitations among those age 65 and older remains constant (Congressional Budget Office, 2013).
This ASPE Research Brief presents information about the risk of needing care and associated costs to provide context for policymakers and others considering LTSS financing proposals. A microsimulation model is used to describe the future care needs for Americans. This model can predict what percentage of individuals will develop a disability, have LTSS needs, use paid LTSS, and among those that use paid LTSS, how much they use and for how long. It estimates care costs, and how they would be financed under current policies. Microsimulation modeling provides not only the average likelihood of these outcomes, but also describes the distribution of these needs and costs. Throughout the Brief we focus on LTSS needs resulting from a disability that meet the criteria set in the Health Insurance Portability and Accountability Act (HIPAA): a need for assistance with at least two ADLs that is expected to last at least 90 days or need for substantial supervision for health and safety threats due to severe cognitive impairment.
Methods
The results of this Brief are derived from analyses using the Urban Institute’s DYNASIM3, a dynamic microsimulation model designed to analyze retirement and aging issues over time. Starting with a representative sample of individuals and families, the model “ages” the data year by year, simulating such demographic events as births, deaths, marriages and divorces, and such economic and health events as labor force participation, earnings, hours of work, disability onset and recovery, retirement, and use and costs of LTSS based on demographic and other characteristics of the population.
As the model ages the population, it calibrates many key demographic and economic outcomes to the intermediate assumptions of the Social Security and Medicare Trustees’ Reports (Board of Trustees, Federal Old-Age & Survivors Insurance & Federal Disability Insurance Trust Funds, 2014; Boards of Trustees, Federal Hospital Insurance & Federal Supplementary Medical Insurance Trust Funds, 2014). Data to inform the model are drawn from the Health and Retirement Survey (HRS), specifically in the areas of health, disability status (including limitations in ADLs and instrumental ADLs and cognitive impairment), LTSS use, and private LTSS insurance coverage.
Current and past LTSS prices are set equal to average prices reported in the literature by state of residence, setting (home care, residential care, nursing home), and whether Medicaid is the payer (Genworth, 2014, 2015; Eljay, 2014; Fossett & Burke, 2010; Grabowski et al., 2004; Mollica, 2009; Ng et al., 2014). Importantly, these base
projections incorporate the full cost of residential care, including room and board in addition to costs associated with meeting care needs. Also, the projections exclude services that are strictly post-acute. Both choices affect comparability with other estimates of LTSS expenses and payer mix. Additional details about the model’s assumptions are available in Favreault and Johnson (2015).
Results
Figure 1 presents projections of the number of persons age 65 and older, including the number meeting HIPAA disability criteria from 2015 to 2065. As expected, given the aging population, the number with HIPAA-level disability is expected to grow from 6.3 million to almost 15.7 million.
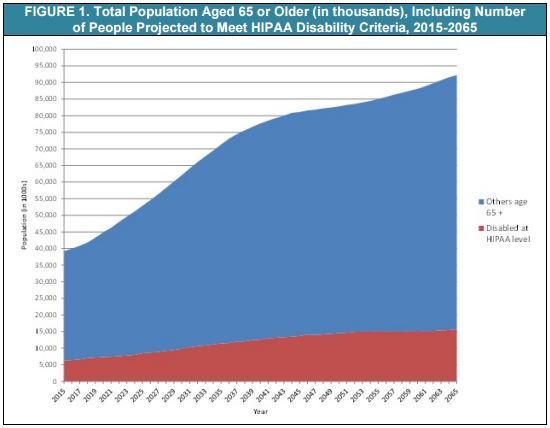
Table 1 displays expected LTSS needs from age 65 to death. It presents life expectancy and then the mean and distribution of the duration of disability for those turning 65 in 2015-2019. The typical person who is alive at age 65 can expected to live another 20.9 years. Fifty-two percent can anticipate having at least some needs for LTSS; 19 percent are expected to have needs that last less than a year, and about 14 percent are expected to have needs that extend beyond five years. It is important to bear in mind that estimates such as these are sensitive to one’s definition of disability. Many people whose disabilities do not reach the HIPAA-level need and use LTSS. With a more expansive definition, for example one that includes those with one ADL limitation and/or multiple instrumental activities of daily living limitations, shares with LTSS needs can be significantly higher (Kemper, Komisar, & Alecxih, 2005/2006; Freedman & Spillman 2014).
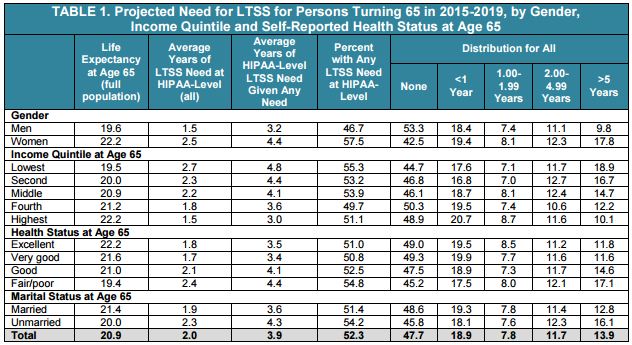
The figures for average LTSS needs mask substantial variation by subpopulation. The average duration of disability is much higher for women than for men--about 2.5 years for all women as compared to 1.5 year for all men. Among women, 57 percent are likely to develop a chronic disability, and the share needing at least five years of care is nearly 18 percent. Similarly, the proportion needing at least five years of care is higher among those in the lowest income quintile at age 65 (19 percent), and among those reporting fair or poor health at age 65 (17 percent). Among those who ever develop a disability, the average duration increases to 4.4 years for women and 3.2 years for men, respectively.
Table 2 examines use of paid LTSS provided for a disability from age 65 onwardmeasured in days. Of the average two years that an older adult will have a disability, they will receive paid care for about one year, and informal caregivers only, such as family and friends, will make up the difference. Again, patterns vary by a range of characteristics. For example, people who are unmarried at age 65 use more formal services than those who are married at age 65, an average of 1.2 years compared to 0.9 years. Those that have poorer health or lower-income levels use more formal services.
While on average, individuals will need one year of paid LTSS, 48 percent of individuals will not use paid, formal LTSS at all (measured in service days, where one year is 365 days of paid LTSS). Among those who need paid LTSS services, about half will need less than a year, and a little more than 10 percent will need five years or more.

Table 3A and Table 3B present the average sum of expenditures that could be expected for LTSS from age 65 until death for the whole population and then for those with a HIPAA-level disability using paid LTSS. The table displays this projected sum of expenditures (from age 65 plus) by setting, and payer for those reaching age 65 over the next five years. This differs from the present discounted value (PDV), the amount that an individual would need to set aside at age 65 to pay for LTSS expenses.

Table 3A and Table 3B combines care that is received at home and that which is received in residential care into a single category of “community care,” which is contrasted with institutional care, focusing on HIPAA-level of care. On average, individuals can expect to spend about $138,000 for LTSS (see Table 3A, or $70,000 in PDV as shown in Table A1). However, among those who ever use paid LTSS, the average cost will be about $266,000 (Table 3B or $134,000 in PDV as shown in Table A2).

Out-of-pocket costs average $72,000. Among those who have out-of-pocket costs,
these costs average $140,000. About three-fifths of individuals face no out-of-pocket
costs. Looking at community and institutional expenses together, two predominant
payers are Medicaid, comprising 34 percent and out-of-pocket payments, comprising
52 percent of the sum of total LTSS expenditures, respectively. Medicare is the next
most important payer, followed by private insurance and other public programs. Payer
predominance varies by setting. For example, Medicaid pays for 51 percent of the total
for institutional settings. For community expenses, in contrast, out-of-pocket payments
by families comprise the majority, about 68 percent.

Expected LTSS costs are higher for women than for men. Women’s costs average $180,000 (Table 4B) compared to $90,000 for men (Table 4A). These could be financed by setting aside about $90,000 for women (Table A5) and about $47,000 for men (Table A3). However, when we focus on those with any LTSS expenditures, this average jumps to $320,000 for women and $194,000 for men (translating to $160,000 and 101,000, respectively, in present value terms as shown in Table A6 and Table A4).

Table 5 presents the distribution associated with Table 3A's and Table 3B's sum of expected costs for those ages 65 and older in 2015-2019. Approximately 15.2 percent of individuals can expect their LTSS expenses from age 65 onward to amount to more than $250,000, while about 6 percent will have positive but low costs (<$10,000). When looked at by payer source, a much smaller percentage (approximately 9 percent) will spend $250,000 or more on LTSS out-of-pocket.

However, these figures mask differences by income. Lower-income individuals are more likely to have more of their costs covered by Medicaid and pay less on average out-of-pocket. Table 6A and Table 6B focus on Medicaid and family out-of-pocket expenses for those turning 65 in 2015-2019. The mean sum and the distribution of the sum are shown by income quintile at age 65. The DYNASIM projections suggest that although Medicaid does reach individuals at all points in the income distribution at age 65, it primarily serves those in the bottom two quintiles. For example, about 36 percent of people in the bottom income quintile at age 65 use Medicaid LTSS, compared to just 5 percent in the top quintile at that age. Those in upper income quintiles who use Medicaid are typically individuals who have survived until their mid- to late 90s, consistent with other research (DeNardi et al., 2013).

Family out-of-pocket expenditures, in contrast, are more concentrated in the higher quintiles. The average out-of-pocket LTSS expense in the top quintile is approximately $97,000 compared to closer to $45,000 in the bottom quintile. But again the mean obscures important distributional information. About 12 percent of people in the top income quintile at age 65 can expect out-of-pocket expenses in excess of a quarter million dollars.

Conclusion
Many Americans who survive to age 65 can expect to need and use LTSS--our estimates suggest this will be true for approximately half the population. On average, the projected duration of LTSS need is two years, and the projected use of paid LTSS is one year. The average cost of this care is $138,000. However, a number of people can expect to need LTSS for many years and to have care costs that total hundreds of thousands of dollars. Even average long-term costs can be out of reach for many Americans without some kind of financing system in place. Medicaid is an important payer for LTSS, but because it serves only those who meet income and asset criteria, many families pay for LTSS out-of-pocket. Private LTSS insurance has only a modest reach, and it predominantly covers costs for those high in the income distribution. Similarly, other public expenditures (for example, including Veterans Administration care) only help to cover small shares of the population with long-term care needs. The results presented here highlight the need for better planning for LTSS to accommodate both average and catastrophic financial risks associated with chronic disability.
Printer-friendly PDF and citations (260.97 kb)